AWA: Academic Writing at Auckland
A Research Methods Report helps the writer learn the experimental procedures and the ways research findings are made in that discipline (Nesi & Gardner, 2012, p. 153). The question to be investigated is often provided as part of the assignment, and there is usually less focus on existing research and much more on the methods and results of the writer's own research. An IMRD (Introduction, Methods, Results, Discussion) structure is often used. AWA Research Methods Reports include Experiment Reports, Field Reports and Lab Reports.
Title: Ceramic variation in Nacula, Fiji
|
Copyright: Gareth Walter
|
Description: Generate data on ceramic variation related to ceramic function and technology. The ceramics you will analyse were excavated from Nacula Island (site Y1-15, locally named Natia) in north-western Fiji.
Warning: This paper cannot be copied and used in your own assignment; this is plagiarism. Copied sections will be identified by Turnitin and penalties will apply. Please refer to the University's Academic Integrity resource and policies on Academic Integrity and Copyright.
Ceramic variation in Nacula, Fiji
|
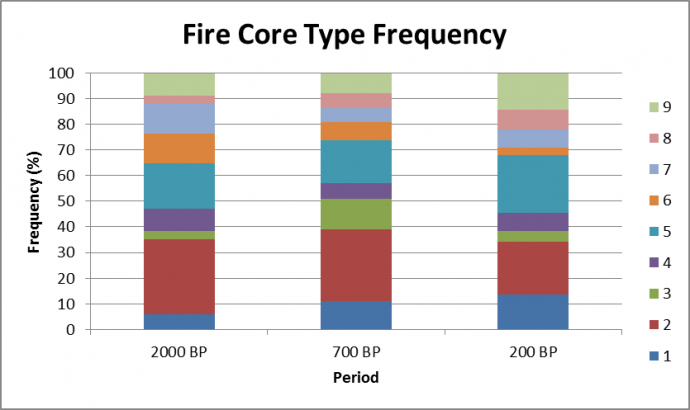
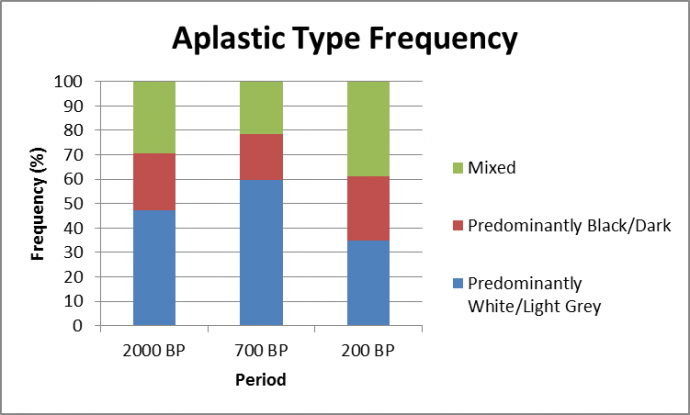
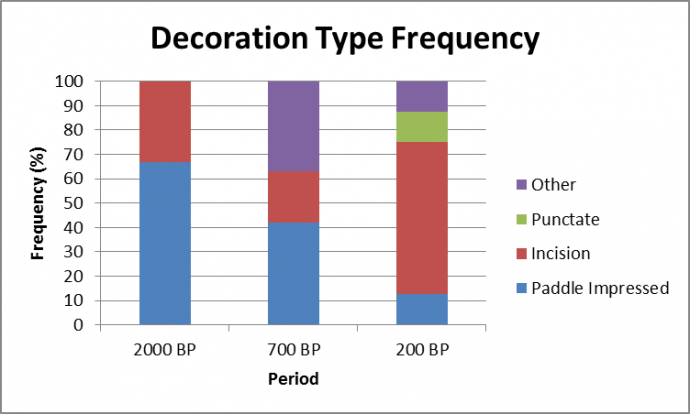
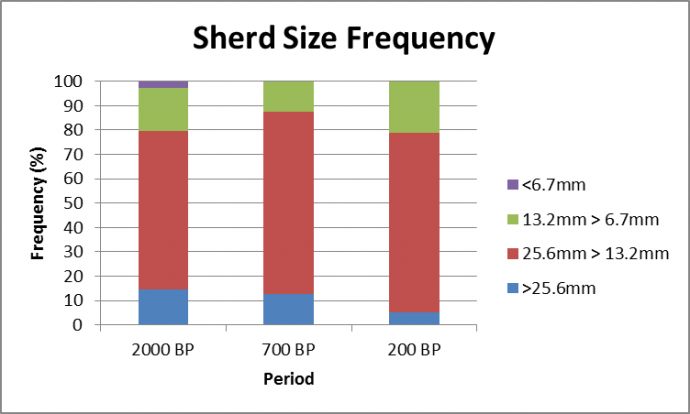
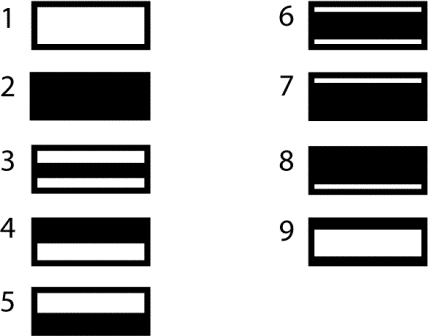
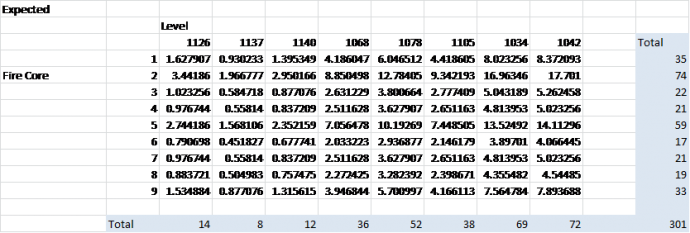
Ceramics are durable in the archaeological record and their ability to be formed into many different shapes with various decoration methods means they can provide substantial information about a culture. These attributes have traditionally been used in a culture history approach to observe cultural migration and diffusion or as diagnostic of particular time periods. The utilitarian aspect of these artefacts had been overlooked until the 1980’s when scientific material testing was introduced to their analysis (Braun, 1983). Ceramics are now used for more than just forming typologies and relative dating, instead they offer insight into the economies and relationships of various groups throughout the world (Braun, 1983; Cochrane, 2013). The function of each vessel may be inferred by physical attributes such as thickness or type and quantity of temper (Braun, 1983). This laboratory exercise will analyse these and selected other attributes in an effort to distinguish change over time in manufacture and use of the ceramics. Previously unstudied material from site Y1-15 on Nacula Island, north-west Fiji, will be used in this exercise. Sherds covering the time frames of 2000 years BP, 700 years BP and 200 years BP are divided into seven bags representing seven different levels from within these time periods. Catalogues 1126, 1137 and 1140 represent the 2000 years BP sample, catalogues 1068, 1078 and 1105 are from 700 years BP and catalogues 1034 and 1042 date to 200 years BP. Methods Ceramic sherds from each bag were size sorted using nested geological screens to divide them into sizes of >25.6mm, 25.6mm > 13.2mm, 13.2mm > 6.7mm and <6.7mm. These sherds were then analysed individually for several different characteristics. First, the part of the vessel that a sherd came from was recorded. Next thickness was measured in three places chosen randomly across the sherd using a set of Mitutoyo digital calipers and a mean calculated for these measurements. Means were rounded to two significant digits to prevent creating the impression of higher precision than was achieved, values of 5 and higher were rounded up while values of 4 or lower were rounded down (Banning, 2002). Following this the fire core of the cross section of each sherd was compared to a template and the closest match recorded. Aplastic type was also studied and recorded based on its colouration being either light grey or white vesus black or a combination of both light and dark. Abundance of aplastic material was also recorded again using a template to determine closest fit of either 5%, 20% or 30%. Both of these measures were done under a Nikon MSZ-2T microscope. Finally, the type of decoration if present was noted as being either paddle impressed, incised, punctate, other types or absent. The spread sheets containing the data and templates used are provided in Appendix 1. There were issues with the raw data that meant some measurements had to be removed before the statistical analysis could be done, for example sherd 503/0 from Catalogue Number 1034, level 13 had an invalid value for its aplastic abundance. Similarly there were a number of sherds in Catalogue Number 1042, level 4 that had been recorded as having 10% aplastic material which was not a predetermined category, these sherds were placed in the 5% category as it was the closet value. This was also the case with sherd 126/0 from Catalogue Number 1105, level 10 which was recorded as having no aplastics, again this was placed in the 5% category. Given the large number of sherds in the later layers and the way the data is categorised it is unlikely that these corrections would have greatly affected the results (Banning, 2002). For statistical analysis the low numbers of sherds in some levels presented a problem for accurate representation of the time period, therefore the mean thickness measurements for each level were combined with those from the same time period to create a larger data set for evaluating changes in thickness of the ceramics across time. This change was quantified statistically using t-tests. Chi-square tests were then performed on the fire core, aplastic type and aplastic abundance data to determine any changes in paste preparation and manufacturing techniques. Variation in decoration was also analysed using chi-square tests to see if any temporal trends could be distinguished. Finally, chi-square tests were again used to determine any association between excavation levels and the size of the sherds recovered. The chi-square tests can be viewed in Appendix 2. For all of these statistical tests the confidence level was set at 95% or a p value of 0.05. The null hypothesis for the t-tests is that there is no statistically significant difference between the two periods being tested while the alternative is that there is a statistical difference at the set confidence level (Drennan, 2009). For the chi-square tests the null hypothesis is that there is a random association between the characteristic measured and the various periods, the alternative hypothesis is that this association is not random (Drennan, 2009). Where there was a non-random association between characteristics and time periods compound bar charts were produced to show the percentage change over time in the assemblages. Results The t-tests to evaluate changes in thickness of ceramics over time returned results indicating no statistically significant difference between the 2000 years BP period and 700 years BP as well as the periods of 2000 years BP and 200 years BP forcing the acceptance of the null hypothesis in both cases. There was, however, a difference between the 700 years BP samples and those from 200 years BP. In all cases the means are different but by less than 1mm. These results can be viewed below in tables 1, 2 and 3. The chi-square test for aplastic abundance also confirmed the null hypothesis of a random association with layers, yet aplastic type and fire core type were shown to have a non-random patterning between layers. This was also the case for decoration and sherd size which returned p values of 0.005367987 and 0.004201911 respectively, these are lower than the 0.05 confidence level also indicating that there is a non-random association between these characteristics and the levels. The frequency of these four characteristics was graphed as a percentage of the assemblage from each period, available below in figures 1, 2, 3 and 4, which confirmed and quantified change over time (Cochrane, 2002).
Table 1) T-test of mean thickness of sherds from 2000 years BP and 700 years BP.
Table 2) T-test of mean thickness of sherds from 700 years BP and 200 years BP.
Table 3) T-test of mean thickness of sherds from 2000 years BP and 200 years BP.
Figure 1) Frequency of fire core types in each time period.
Figure 2) Frequency of aplastic types in each time period.
Figure 3) Frequency of decoration styles in each time period.
Figure 4) Frequency of sherd sizes from each time period.
The trends for these changes indicate a change in the function and technology of the ceramics (Braun, 1983). A progression towards marginally thicker sherds at 700 years BP and later to thinner sherds at 200 years BP represents likely shifts in use of the ceramics (Braun, 1983). Changes in aplastic type between dark and mixed material during 2000 years BP to lighter material at 700 years BP and then back again for 200 years BP suggests an understanding of the effects of various tempers on the production process and final attributes of the end product (Braun, 1983). This knowledge of varying effects on production is also evident from the prevalence of firing core type 2 in the period dominated by lighter temper material and being less common in those with higher levels of dark temper (Cochrane, 2002). There is a wide range of tempers with increased diversity in fire core types being used in the youngest period which indicates knowledge of the firing methods required for different outcomes and of best fit with the material created (Cochrane, 2002). Likewise the variety of decoration increases over time while sherds are generally smaller in the younger deposits. Discussion
The trends of changes noted above have clear directionality and therefore represent a conscious shift in manufacturing technology and use of ceramics on Nacula Island over the course of time. The move from thicker to thinner ceramics can be interpreted in two ways. Firstly, changes in the manufacturing technology and temper material allowed ceramics to be made thinner, or secondly, and probably more likely, that there was a change in the function of ceramics causing a swing in the desired attributes (Braun, 1983). Braun (1983) suggests that when this patterning occurs there is a change from a need for mechanical strength to a requirement for thermal shock resistance and is potential evidence for use in cooking instead of storage. A relationship exists between thinner sherds and a higher proportion of darker or mixed temper material and is accompanied by changes in fire core types indicative of differing firing methods accommodating the properties of the aplastic material and possibly preferential use of certain tempers for different applications (Braun, 1983; Cochrane, 2002). Random association between aplastic abundance may be seen as representing a factor that has no relation to function or technology and therefore may be representative of individual choice or preference of the manufacturer.
Increase in the variety of decoration applied to the ceramics may represent an increase in contact outside of the immediate area. This could be in the form of trade or migration. If the assemblage were compared using a cladistics approach as demonstrated by Ethan Cochrane (2013) then potential areas of contact and interaction may become apparent while sourcing analysis of sherds may show that they were made elsewhere alluding to exchange networks. Additional investigation into linguistic or genetic relationships may offer evidence for the case of migration. Another potential explanation is independent innovation, if a cladistics comparison showed significant difference between other areas and the Nacula ceramics then this may be true (Clark, 2009). However, there are potential taphonomic explanations also. Given the small number of sherds recovered from the 2000 years BP range, only 34 as compared to 126 from 700 years BP and 141 dating to 200 years BP, and the proportion of decorated sherds to undecorated ones across the entire assemblage it may be a case of variation not being preserved (Rapp and Hill, 2006).
A general trend towards small sherds in the younger layers also requires explanation. Thinner ceramics are known to be less resistant to mechanical stress and thus may explain the higher abundance of small sherds (Braun, 1983). Again taphonomy may offer insight as larger sherds may be less prone to disintegrating long term while smaller ones are affected by post-depositional forces that remove them from the record, however given the durability of ceramics it is unlikely that this is true (Braun, 1983). Yet some post-depositional forces may be a potential explanation with cultural disturbance in the form of agriculture or natural disturbance such as bioturbation in the upper levels of the deposits causing ceramic sherds to be broken up further (Rapp and Hill, 2006). Both of these may take the form of digging or trampling of the artefacts. Analysis of middens and other dietary information such as isotopes in combination with microfossils and pollen studies may help to determine the influence of agriculture in the area, while soil analyses may aid in determining if weathering is the cause (Rapp and Hill, 2006).
Conclusion The assemblage analysed shows statistically significant changes in many attributes over the three time periods. A preference for thinner ceramics may indicate increased use as cooking vessels while changes in aplastic type and fire cores suggests differences in manufacturing technology and the intended function of the end product. Increased variation in the decoration style of sherds also presents the possibility of increasing interaction between groups outside of the immediate area or migration into Nacula Island. Differences in the size of sherds between the periods may be a function of the mechanical resistance of the ceramic material or related to post-depositional factors. All of the possibilities require further investigation which is outside the scope of this study. However, the data presented here would indicate that Braun’s concepts of ceramics as tools made for specific functions and evident through analysis of their attributes is correct and that their manufacture and final use can be determined using this approach. It also proves that ceramics may be used outside of culture history approaches increasing their usefulness to archaeology.
Bibliography Banning, E.B. 2002. The Archaeologist’s Laboratory: The Analysis of Archaeological Data. Kluwer Academic: New York. Braun, David P. 1983. Pots as Tools. In James A. Moore and Arthur S. Keene (eds) Archaeological Hammers and Theories. Academic Press. Clark, Geoffrey. 2009. Post-Lapita Ceramic Change in Fiji. The Early Prehistory of Fiji, Terra Australis. 31 (2009): 307-320. Cochrane, Ethan E. 2002. Explaining the Prehistory of Ceramic Technology on Waya Island, Fiji. Archaeology in Oceania. 37 (1): 37-50. Cochrane, Ethan E. 2013. Quantitative Phylogenetic Analyses of Lapita Decoration in Near and Remote Oceania. University of Otago Studies in Archaeology. 25 (2013): 1-26 Drennan, R.L. 2009. Statistics for Archaeologists: a common sense approach. Springer: New York. Rapp, George and Christopher L. Hill. 2006. Geoarchaeology: The Earth-Science Approach to Archaeological Interpretation. 2nd ed. New Haven: Yale University Press.
Appendix 1
Other tables ommitted here
Appendix 2 Fire core chi-square test
Aplastic type chi-square test
Aplastic abundance chi-square test Tables omitted here
Decoration type chi-square test Tables omitted here
Sherd size chi-square test Tables omitted here |
|||||||||||||||||||||||||||||||||||||||||||||||||||||||||||||||||||||||||||||||||||||||||||||||||||||||||||||||||||||||||||||||||||||||||||||||||||||||||||||||||||||||||||||||||||||||||||||||||||||||||||||||||||||||||||||||||||||||||||||||||||||||||||||||||||||||||||||||||||||||||||||||||||||||||||||||||||||||||||||||||||||||||||||||||||||||||||||||||||||||||||||||||||||||||||||||||||||||||||||||||||||||||||||||||||||||||||||||||||||||||||||||||||||||||||||||||||||||||||||||||||||||||||||||||||||||||||||||||||||||||||||||||||||||||||||||||||||||||||||||||||||||||||||||||||||||||||||||||||||||||||||||||||||||||||||||||||||||||||||||||||||||||||||||||||||||||||||||||||||||||||||||||||||||||||||||||||||||||||||||||||||||||||||||||||||||||||||||||||||||||||||||||||||||||||||||||||||||||||||||||||||||||||||||||||||||||||||||||||||||||||||||||||||||||||||||||||||||||||||||||||||||||||||||||||||||||||||||||||||||||||||||||||||||||||||||||||||||||||||||||||||||||||||||||||||||||||||||||||||||

