
Table of Contents

Executive Summary
This report explains if 1Above should make any improvements in their current marketing mix for their product. Before any adjustment is made, it is important for 1Above to understand their consumer perceptions of their product. In this report, we would focus on New Zealand residents who have at least travelled internationally by air once within the last year.
Understanding this would require a carefully designed online survey, and findings from this study would be analysed in the next section of this report. Three findings are discovered, and the last two findings shows unexpected outcomes about product appeal for frequent travellers and recommendation likelihood respectively. This report also gives recommendations of what 1Above should do. In short, we recommend that 1Above should do further qualitative research before changing any marketing strategy. It is essential not to create any unwanted negative perceptions on consumers.
After 1Above has complete understanding on their consumer’s perceptions, we believe that 1Above can make the right decision on improving 1Above’s marketing mix to increase sales.
Background and Problem Orientation
1Above launched a travel recovery drink in the form of drinks and effervescent tablets. 1Above wants to know if their current marketing mix needs to be adjusted. 250 customers of 1Above have been surveyed to find out any trends on consumer perceptions. Based on this study, this report will analyse if 1Above can expand their sales volume by marketing their product as a drink that can be used other than flying/travelling. We would also find out if there is high product appeal on 1Above’s product on frequent travellers, and whether customers are likely to recommend 1Above’s travel recovery drink.
Methodology and Sample Profile
The online survey was conducted through the Valued Opinions online panel from 13 March 2017 to 27 March 2017. The data from the survey is specifically obtained from 250 New Zealand customers who have at least travelled internationally by air once within the last year.
To make sure that the survey results are accurate, it is important to ensure that we are surveying the right target customers, with the same amount of male and female respondents. This is done by placing a quota and several screeners to ensure that the respondent meets specific criteria to participate, and set these screeners upfront so that non-qualified respondent would not need to do the whole survey.
First of all, the survey would ask their gender to ensure that the number of male and female respondents are identical. Next, respondents would be screen out if they are working in Marketing, Advertising, Public Relations, and Jetlag / Flight recovery products industry. The survey would also exclude respondents that do not live in New Zealand or could not specify where they live. Finally, the screener would filter out respondents so that only those who take at least one international flights and purchase 1Above’s product within last year can take part in the survey.
Findings
Finding 1
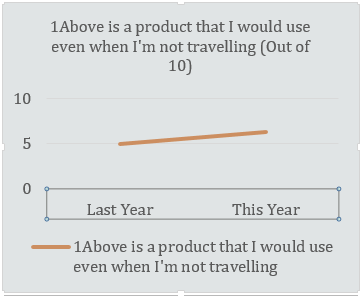
Finding 1 will identify whether New Zealand customer perceptions of 1Above as an everyday supplement differs to that of last year (rating of 5/10; where 1=strongly disagree and 10 =strongly agree) after promoting 1Above as a product for everyday use. The result will show if the marketing campaign was effective, which is important before 1Above continues to promote the product further as something that consumers can use other than flying. Here, we would analyse the survey question that is responded by 241 respondents:
“1Above is a product that I would use even when I’m not travelling (e.g., for general wellbeing, energy, etc).”
The survey data is analysed by using IBM SPSS Statistics software, and the results are:
- There is evidence of a difference (at 5% significance level) between last year’s rating (5/10) and this year’s rating for 1Above statement agreement.
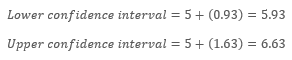
- With 95% confidence, it is estimated that the average agreement of statement about 1Above is between 5.93 and 6.63 (out of 10), which is higher than last year.
This finding is a good news for 1Above as it suggests that at least 1Above’s marketing campaign to promote 1Above as a product for everyday use has an effect (between 0.93 and 1.63 higher rating of agreement).
Finding 2
Finding 2 identifies whether there is a difference between frequent and less-frequent international travellers in terms of their likelihood to purchase 1Above again (at the 5% level). Frequent traveller is defined as those who travelled more than 2 times per year while less-frequent traveller refers to those that travel 1-2 times per year. The result will show if 1Above’s appeal is high among two groups of international travellers (Frequent and Less-Frequent). Here, we would analyse the survey question that is responded by 133 Less-Frequent and 117 Frequent international travellers:
“How likely are you to purchase 1Above again?”
The survey data is analysed by using IBM SPSS Statistics software, and the results are:
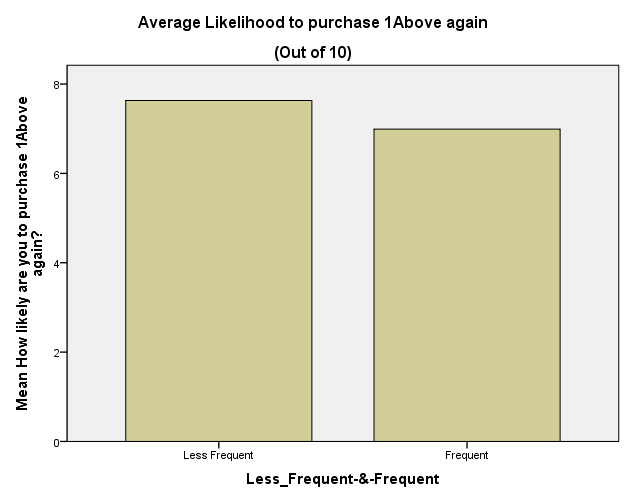
- There is evidence of a significant difference in the average purchase intention for Frequent international travellers as compared to Less-Frequent international travellers.
- With 95% confidence, it is estimated that the average purchase intention for Less-Frequent international travellers is between 057 and 1.223 points higher than that of Frequent international travellers.
This finding implies 1Above’s appeal is high for both frequent and less frequent international travellers. However, frequent international travellers would less likely to purchase 1Above again. 1Above would want to give attention to both groups of international travellers in order to increase sales volume.
Finding 3
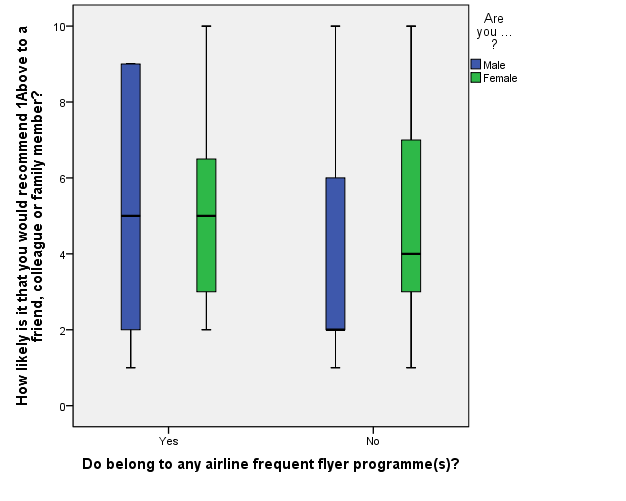
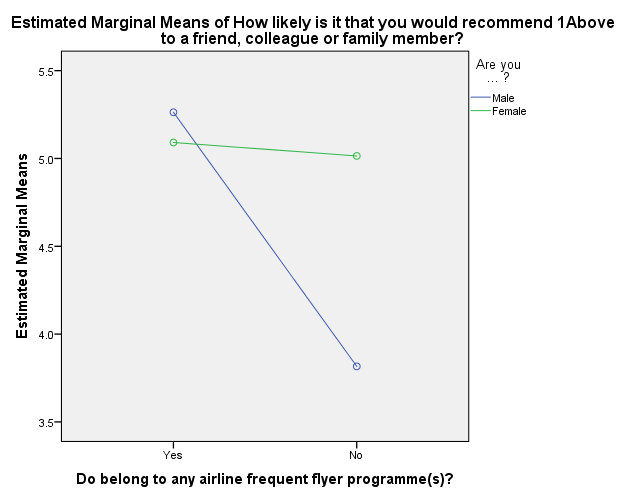
Finding 3 will determine if customers are likely to recommend 1Above to other people. This is done by investigating the likelihood of frequent flyer programme customer versus non-frequent flyer programme customer of any airline to recommend 1Above, and whether this is dependent on gender. Further qualitative research needs to be done if one or more particular groups are less likely to recommend 1Above. Here, we would analyse the survey question
“How likely is it that you would recommend 1Above to a friend, colleague or family member?”
 The survey data is analysed by using IBM SPSS Statistics software, and the results are shown below:
There is evidence of a significant interaction effect. This means that it suggests that the effect of gender on 1Above recommendation likelihood does depend on whether customers belongs in an airline Frequent Flyer programme or not (vice versa).
Therefore, rather than considering the main effects, we can look at four groups individually.
From looking at the sample means in the ‘Descriptive Statistics’ table, it appears that:
- Males that belong to any airline frequent flyer programme(s) have a higher chance of recommending 1Above compare to Males that do not belong to any airline frequent flyer programme(s).
- It seems that Females have a similar chance of recommending 1Above regardless of whether they belong to any airline frequent flyer programme(s).
- There appears to be a similarity in the likelihood of recommending 1Above between Males and Females that belong to any airline frequent flyer programme(s).
- Males that do not belong to any airline frequent flyer programme(s) have the lowest likelihood to recommend 1Above.
This finding suggests that all groups except males that do not belong to any airline frequent flyer programme have consistent likelihood (around 5 to 6 out of 10) to recommend the 1Above brand to other people. However, one particular group, “males that are not in any airline frequent flyer programme(s)” is less likely to recommend 1Above.
Recommendations
In conclusion, 1Above needs to do several marketing actions and research before altering their current marketing mix that will be aimed at New Zealand consumers.
Finding 1 shows that 1Above’s marketing campaign that is conducted last year is successful, which is proven by the increment of customer’s rating. 1Above consumers are now aware that they can use the product even when they are not travelling. Hence, it is highly recommended that 1Above continues to do further marketing campaign so that consumers are more aware that they can use 1Above as an everyday supplement even when they are not flying.
Finding 2 illustrates that less-frequent travellers are more likely to purchase 1Above again than frequent travellers. Reasons for this could be frequent customers are aware of other brands, or they start to get less satisfaction after consuming the product repetitively during flight. Although the values are may not be practically significant, 1Above may want to do a qualitative research specifically for why frequent international travellers are less likely to purchase 1Above again. This issue needs to be understood before altering the current marketing mix to prevent unwanted changes in consumer’s perceptions.
Finding 3 suggests that both males and females that are in frequent flyer programme have similar likelihood to recommend 1Above. However, males that are not in frequent flyer programme are less likely to recommend 1Above. Considering that females that are not in frequent flyer programme have a consistent chance on recommending 1Above, there is a gender effect here. This needs an urgent marketing attention because we do not want a particular group of consumers to affect other groups in a negative manner through word of mouth. Qualitative research needs to be conducted to find out why males in non-frequent flyer programme differ in their likelihood to recommend 1Above. Though, 1Above should re-check if there are marketing implications on the survey.
Technical Appendices
Here are the methods to conduct statistical test for the three findings.
Technical Finding 1
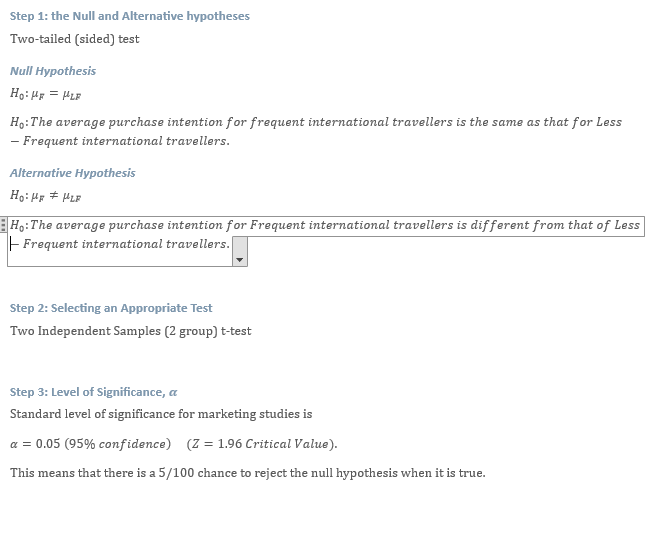
Step 1: the Null and Alternative hypotheses
Two-tailed (sided) test
Null Hypothesis

Alternative Hypothesis

Step 2: Selecting an Appropriate Test
One-Sample T-test on Means
Step 3: Level of Significance,
Standard level of significance for marketing studies is
a = 0.05 (95% confidence) (Z= 1.96 Critical Value).
This means that there is a 5/100 chance to reject the null hypothesis when it is true.
Step 4: Test Statistic Calculation from Collected Survey Data with SPSS
|
|
One-Sample Statistics
|
|
|
|
|
N
|
Mean
|
Std. Deviation
|
Std. Error Mean
|
|
|
|
1Above is a product that I would use even when I’m not travelling (e.g., for general wellbeing, energy etc.)
|
241
|
6.28
|
2.765
|
.178
|
|
|
One-Sample Test
|
|
|
Test Value = 5
|
|
t
|
df
|
Sig. (2-tailed)
|
Mean Difference
|
95% Confidence Interval of the Difference
|
|
Lower
|
Upper
|
|
1Above is a product that I would use even when I’m not travelling (e.g., for general wellbeing, energy etc.)
|
7.199
|
240
|
.000
|
1.282
|
.93
|
1.63
|
| |
|
|
|
|
|
|
|
|
|
|
|
|
Step 5: Analyse calculation result from SPSS output
The mean of the statement agreement is 6.28 from 241 respondents surveyed. 
The test statistic in absolute value (t-statistic) is greater than the critical value (1.96). 
The p-value of significance (2-tailed) is smaller than the cut-off value (0.05). 
Step 6: Interpret calculation result from SPSS output
From the t-statistic and the p-value of significance at 95% confidence, it can be determined that there is a statistical evidence against the null hypothesis. The alternative hypothesis is then accepted. In other words, there is a difference at the 5% significance level between this year’s rating and last year’s rating that is statistically significant
Confidence Interval = between 5.93 and 6.63 (higher than last year 5/10)
Step 7: Checking Assumptions underlying the test
Two assumptions to be checked to ensure the results from this test is valid:
Independence of Observations
- Every single person in a marketing survey has to be independent of the others. The survey uses a probability sampling technique (random sampling technique), which meets the assumption.
Data Normally Distributed
- The Central Limit Theorem states that data will usually be normally distributed for sample sizes greater than 30. In this test, 241 samples are greater than 30. Hence, it can be assumed that the data is normally distributed.
Step 8: Conclusions (non-technical)
There is evidence of a difference (at 5% significance level) between last year’s rating (5/10) and this year’s rating for 1Above statement agreement.
With 95% confidence, it is estimated that the average agreement of statement about 1Above is between 5.93 and 6.63 (out of 10), which is higher than last year.
Technical Finding 2
Step 1: the Null and Alternative hypotheses
Step 4: Test Statistic Calculation from Collected Survey Data with SPSS
|
Group Statistics
|
|
|
Less_Frequent-&-Frequent
|
N
|
Mean
|
Std. Deviation
|
Std. Error Mean
|
|
How likely are you to purchase 1Above again?
|
Less Frequent
|
133
|
7.63
|
2.298
|
.199
|
|
Frequent
|
117
|
6.99
|
2.369
|
.219
|
|
Independent Samples Test
|
|
|
Levene's Test for Equality of Variances
|
t-test for Equality of Means
|
|
F
|
Sig.
|
t
|
df
|
Sig. (2-tailed)
|
Mean Difference
|
Std. Error Difference
|
95% Confidence Interval of the Difference
|
|
|
Lower
|
Upper
|
|
|
How likely are you to purchase 1Above again?
|
Equal variances assumed
|
4.296
|
.039
|
2.166
|
248
|
.031
|
.640
|
.296
|
.058
|
1.222
|
|
|
Equal variances not assumed
|
|
|
2.162
|
241.873
|
.032
|
.640
|
.296
|
.057
|
1.223
|
|
Step 5: Analyse calculation result from SPSS output
The mean of the purchase intention of Less Frequent international travellers (n = 133 ) are:
x = 7.63 out of 10
The mean of the purchase intention of Frequent international travellers (n = 117 ) are:
x = 6.99 out of 10
Before going to the next step, we need to determine which t-statistic and p-value are we going to use. Levene’s test of Equality of Variances would help us determine if we should use the value in the top or bottom row. If p-value of significance of Levene’s test is lower than 0.05, there is an evidence against the assumption of equal variance; which means that the variance is not equal between groups. In the SPSS output, the p-value is higher than 0.05 ( ); there is evidence against the assumption of equal variance. Hence, we will use the value in the bottom row.
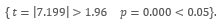
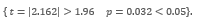
The test statistic in absolute value (t-statistic) is greater than the critical value (1.96). t = l2.162l > 1.96
The p-value of significance (2-tailed) is smaller than the cut-off value (0.05). p = 0.032 <0.05
Confidence Interval is calculated by (Less frequent - Frequent )
Lower confidence interval = Less Frequent is 0.057 points higher than Frequent
Upper confidence interval = Less Frequent is 1.223 points higher than Frequent
Step 6: Interpret calculation result from SPSS output
From the t-statistic and the p-value of significance at 95% confidence, it can be determined that there is a statistical evidence against the null hypothesis. The alternative hypothesis is then accepted. In other words, the average purchase intention for Frequent international travellers is different statistically at the 5% significance level from that of Less-Frequent international travellers
Confidence Interval = Less Frequent is between 0.057 and 1.223 points higher than Frequent.
Step 7: Checking Assumptions underlying the test
Three assumptions to be checked to ensure the results from this test is valid:
Independence of Observations
- Every single person in a marketing survey has to be independent of the others. The survey uses a probability sampling technique (random sampling technique), which meets the assumption.
Data Normally Distributed
- The Central Limit Theorem states that data will usually be normally distributed for sample sizes greater than 30. In this test, 250 samples are greater than 30. Hence, it can be assumed that the data is normally distributed.
Equal Variance
- Levene’s test illustrates that the two groups do not have equal variance, then results need to be read from the bottom row of the output (p = 0.039 < 0.05).
Step 8: Conclusions (non-technical)
There is evidence of a significant difference in the average purchase intention for Frequent international travellers as compared to Less-Frequent international travellers.
With 95% confidence, it is estimated that the average purchase intention for Less-Frequent international travellers is between 0.057 and 1.223 points higher than that of Frequent international travellers.
Technical Finding 3
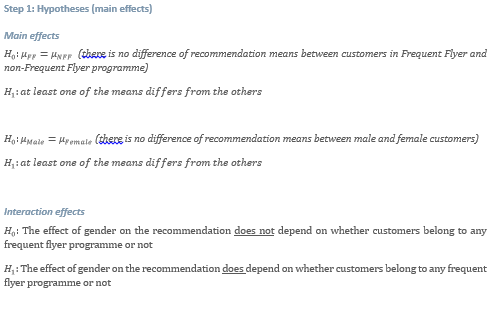
Step 2: Generate SPSS Output using Two-Way ANOVA
|
Between-Subjects Factors
|
|
|
Value Label
|
N
|
|
Do belong to any airline frequent flyer programme(s)?
|
1
|
Yes
|
131
|
|
2
|
No
|
119
|
|
Are you ... ?
|
1
|
Male
|
125
|
|
2
|
Female
|
125
|
|
Descriptive Statistics
|
|
Dependent Variable: How likely is it that you would recommend 1Above to a friend, colleague or family member?
|
|
Do belong to any airline frequent flyer programme(s)?
|
Are you ... ?
|
Mean
|
Std. Deviation
|
N
|
|
Yes
|
Male
|
5.26
|
2.729
|
76
|
|
Female
|
5.09
|
2.279
|
55
|
|
Total
|
5.19
|
2.542
|
131
|
|
No
|
Male
|
3.82
|
2.667
|
49
|
|
Female
|
5.01
|
2.689
|
70
|
|
Total
|
4.52
|
2.733
|
119
|
|
Total
|
Male
|
4.70
|
2.786
|
125
|
|
Female
|
5.05
|
2.508
|
125
|
|
Total
|
4.87
|
2.651
|
250
|
|
Levene's Test of Equality of Error Variancesa
|
|
Dependent Variable: How likely is it that you would recommend 1Above to a friend, colleague or family member?
|
|
F
|
df1
|
df2
|
Sig.
|
|
1.612
|
3
|
246
|
.187
|
|
Tests the null hypothesis that the error variance of the dependent variable is equal across groups.a
|
|
a. Design: Intercept + D4 + D1 + D4 * D1
|
|
Tests of Between-Subjects Effects
|
|
Dependent Variable: How likely is it that you would recommend 1Above to a friend, colleague or family member?
|
|
Source
|
Type III Sum of Squares
|
df
|
Mean Square
|
F
|
Sig.
|
|
Corrected Model
|
70.289a
|
3
|
23.430
|
3.432
|
.018
|
|
Intercept
|
5573.707
|
1
|
5573.707
|
816.337
|
.000
|
|
D4
|
35.147
|
1
|
35.147
|
5.148
|
.024
|
|
D1
|
15.933
|
1
|
15.933
|
2.334
|
.128
|
|
D4 * D1
|
28.432
|
1
|
28.432
|
4.164
|
.042
|
|
Error
|
1679.615
|
246
|
6.828
|
|
|
|
Total
|
7684.000
|
250
|
|
|
|
|
Corrected Total
|
1749.904
|
249
|
|
|
|
|
a. R Squared = .040 (Adjusted R Squared = .028)
|
Profile Plots
Step 3: Interpretation of the output in SPSS
As illustrated in the Profile Plots, both lines are not parallel (non-parallel lines) to each other. Hence, there is an Interaction Effect, and (in step 1 heading ‘Interaction effects’) is accepted.
The existence of the Interaction Effect can also be shown in the ‘Tests of Between-Subjects Effects’ table. D4*D1 shows the interaction effect between frequent flyer programme and gender, and the p-value of significance of it is less than the cut-off value 0.05 (p = 0.042 <0.05). Therefore, there is evidence against the null hypothesis of no interaction effect. In other words, there is a significant Interaction Effect (alternative hypothesis accepted). From here, we will not need to consider the main effects anymore due to interaction effect happening.
Step 4: Checking Assumptions underlying the test
Three assumptions to be checked to ensure the results from this test is valid:
Independence of Observations
- Every single person in a marketing survey has to be independent of the others. The survey uses a probability sampling technique (random sampling technique), which meets the assumption.
Data Normally Distributed
- The Central Limit Theorem states that data will usually be normally distributed for sample sizes greater than 30. In this test, 250 samples are greater than 30. Hence, it can be assumed that the data is normally distributed.
Equal Variance on the groups
- In the ‘Levene’s Test of Equality of Error Variances’ table, the p-value of significance is greater than the cut-off value 0.05 (p = 0.187 >0.05 ). This means that there is evidence that variances are equal. This assumption is hence met. Test results is valid.
Step 5: Conclusion (non-technical)
There is evidence of a significant interaction effect. This means that it suggests that the effect of gender on 1Above recommendation likelihood does depend on whether customers belongs in an airline Frequent Flyer programme or not (vice versa).
Therefore, rather than considering the main effects, we can look at four groups individually.
From looking at the sample means in the ‘Descriptive Statistics’ table, it appears that:
- Males that belongs to any airline frequent flyer programme(s) have higher chance on recommending 1Above compare to Males that does not belong to any airline frequent flyer programme(s).
- It seems that Females have similar chance of recommending 1Above regardless of whether they belong to any airline frequent flyer programme(s).
- There appears to be a similarity in the likelihood of recommending 1Above between Males and Females that belong to any airline frequent flyer programme(s).
- Males that does not belong to any airline frequent flyer programme(s) have the lowest likelihood to recommend 1Above.